17. Customized Point-Locator
17.1 Locating Eye and Nose
17.2 Feret 100
17. 3 Run Your Data
17.4 Analysis
The Point-Locator is a special version of the Segment-Locator; it locates points by locating the segment first and specifies points based on the position of the located segment.
This chapter introduces a Customized Point-Locator, in which the training segment is already designed and encoded into the software. You do not need to train the software. You will run the software with the Batch/Run command.
You can run this example with three clicks:
- Click Example/SegLocator/Point Locator: Feret 20;
- Click Batch/Run;
- Click Example/SegLocator/Point Locator: Results.
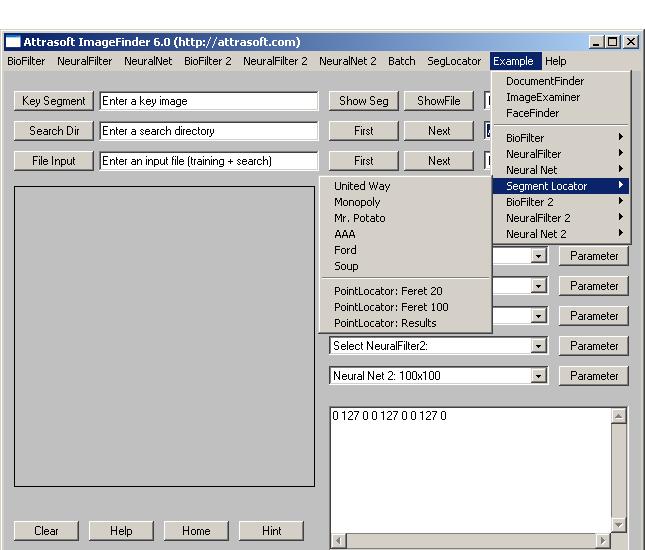
Figure 17.1 Customized Point-Locator.
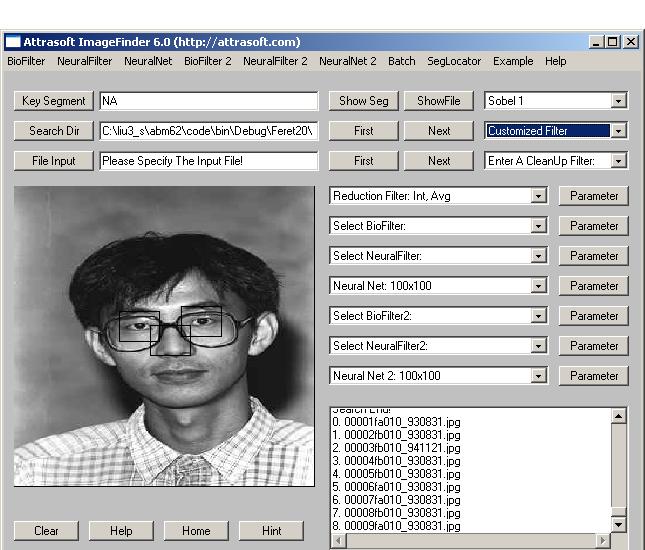
Figure 17.2 Visual results of Customized Point-Locator.
In this example, we will locate the eyes and nose in a face. This customized module will work only for the following images:
1. Ferret Database Face Image, 256x384 pixels;
2. Only front view images can be used.
The first 20 images in the Feret database will be used in this example.
We will now explain this example. The first click, Example/SegLocator/Point Locator: Feret 20, will load the batch file. The second click, Batch/Run, will execute this batch file. Note the execution code 1101. Each customized version has its own batch code. The Point-Locator will:
1. Locate the Face;
2. Locate the left eye, the right eye, and nose ROI (Region Of Interest);
After the Point-Locator locates the left eye segment, the right eye segment, and the nose segment, it will compute their coordinates based on the located segments. The training images are hard coded into the Customized Point-Locator, therefore, there is no need for training. The results will look like this:
0. 00007fa010_930831.jpg
Left eye: 98.0 165.01. 00002fb010_930831.jpg
Right: 159.0 161.0
Nose: 127 199
Left eye: 107.0 166.02. 00003fb010_941121.jpg
Right: 158.0 157.0
Nose: 126 184
Left eye: 89.0 192.0
Right: 153.0 196.0
Nose: 119 229
The third click, Example/SegLocator/Point Locator: Results, will show the results visually; the Point-Locator will draw a 40x30 square on left eye, the right eye, and the nose. The Point-Locator will present an animation, which runs through all images. This will last 80 seconds, 4 seconds per image.
You can run this example with three clicks:
- Click Example/SegLocator/Point Locator: Feret 100;
- Click Batch/Run;
- Click Example/SegLocator/Point Locator: Results.
You can use other Feret images by using a different folder. Here is the operation:
- Click Example/SegLocator/Point Locator: Feret 20 to open the batch file;
- Click Batch/Load to load the parameters;
- Click Search Dir button to select the folder containing your images;
- Click Batch/Save to create the batch file; make sure the execution code (second line) is 1101;
- Click Batch/Run to run your data;
- Click Example/SegLocator/Point Locator: Results to see the results visually.
Now we will compare the output of the Point-Locator for the Feret
20 example with human work. The following are two tables for the left
eye and the right eye. The images are 256x384 pixels in size. The units
for all measurements are pixels. Each table has the following columns:
Image Number
Human Result: x1
Human Result: y1
Point-Locator: x2
Point-Locator: y2
Gap = |x2-x1| + |y2-y1|
Left Eye:
x1
y1 x2
y2
1 98 165
101.0 164.0
4.0
2 106 165
107.0 166.0
2.0
3 88 191
89.0 192.0
2.0
4 92 171
91.0 172.0
2.0
5 102 150
103.0 150.0
1.0
6 112 175
113.0 177.0
3.0
7 95 163
98.0 165.0
5.0
8 91 170
93.0 171.0
3.0
9 106 179
107.0 180.0
2.0
10 124 185
126.0 188.0
5.0
11 112 158
112.0 157.0
1.0
12* 112 159
112.0 171.0
12.0
13 112 180
110.0 181.0
3.0
14 121 170
121.0 165.0
5.0
15 107 184
108.0 185.0
2.0
16 104 164
105.0 166.0
3.0
17 123 183
123.0 184.0
1.0
18 96 176
94.0 177.0
3.0
19 104 158
106.0 160.0
4.0
20 119 150
120.0 151.0
2.0
sum 65.0
Here * means error. There are 40 measurements total (20 pairs of (x,y)).
The total gap is 65, and the average measurement Gap = 65/40= 1.6. There
is one error; Error Rate = 2.5% = 1/40.
Right Eye:
x1 y1 x2 y2
1* 161 163
149.0 165.0 14.0
2 158
160 158.0 157.0
3.0
3 152
194 153.0 196.0
3.0
4 149
167 147.0 167.0
2.0
5 158
145 159.0 145.0
1.0
6 170
173 168.0 173.0
2.0
7 160
159 159.0 161.0
3.0
8 148
161 148.0 162.0
1.0
9 160
173 160.0 174.0
1.0
10 176
186 178.0 188.0
5.0
11 168
160 164.0 161.0
5.0
12 169
171 171.0 173.0
4.0
13 168
181 171.0 183.0
5.0
14 181
174 178.0 174.0
3.0
15 160
180 158.0 180.0
2.0
16 150
163 151.0 164.0
2.0
17 177
187 179.0 188.0
3.0
18 142
176 143.0 176.0
1.0
19 165
162 167.0 163.0
3.0
20 161
147 162.0 149.0
3.0
sum 65.0
Average measurement Gap = 65/40 =1.6
Error Rate = 2.5% = 1/40.
Other than a few percentages of errors, the human reading and the Point-Locator
readings are very close.